
What to do with all that Halloween candy? Put it into a spreadsheet and graph it, obviously. Follow these directions to create a Halloween Spreadsheet to teach your children about graphing, reading data, computing skills, and to begin a surprisingly fun yearly tradition.
What is a Halloween Spreadsheet?
One of my favorite Halloween activities is sorting candy. I loved it as a kid, I loved it as a teacher, I love it as a parent.
For my kids, I started Halloween candy sorting with them right from the get-go. Beginning in the preschool years, after sorting our Halloween candy, I’d ask them questions about the piles.
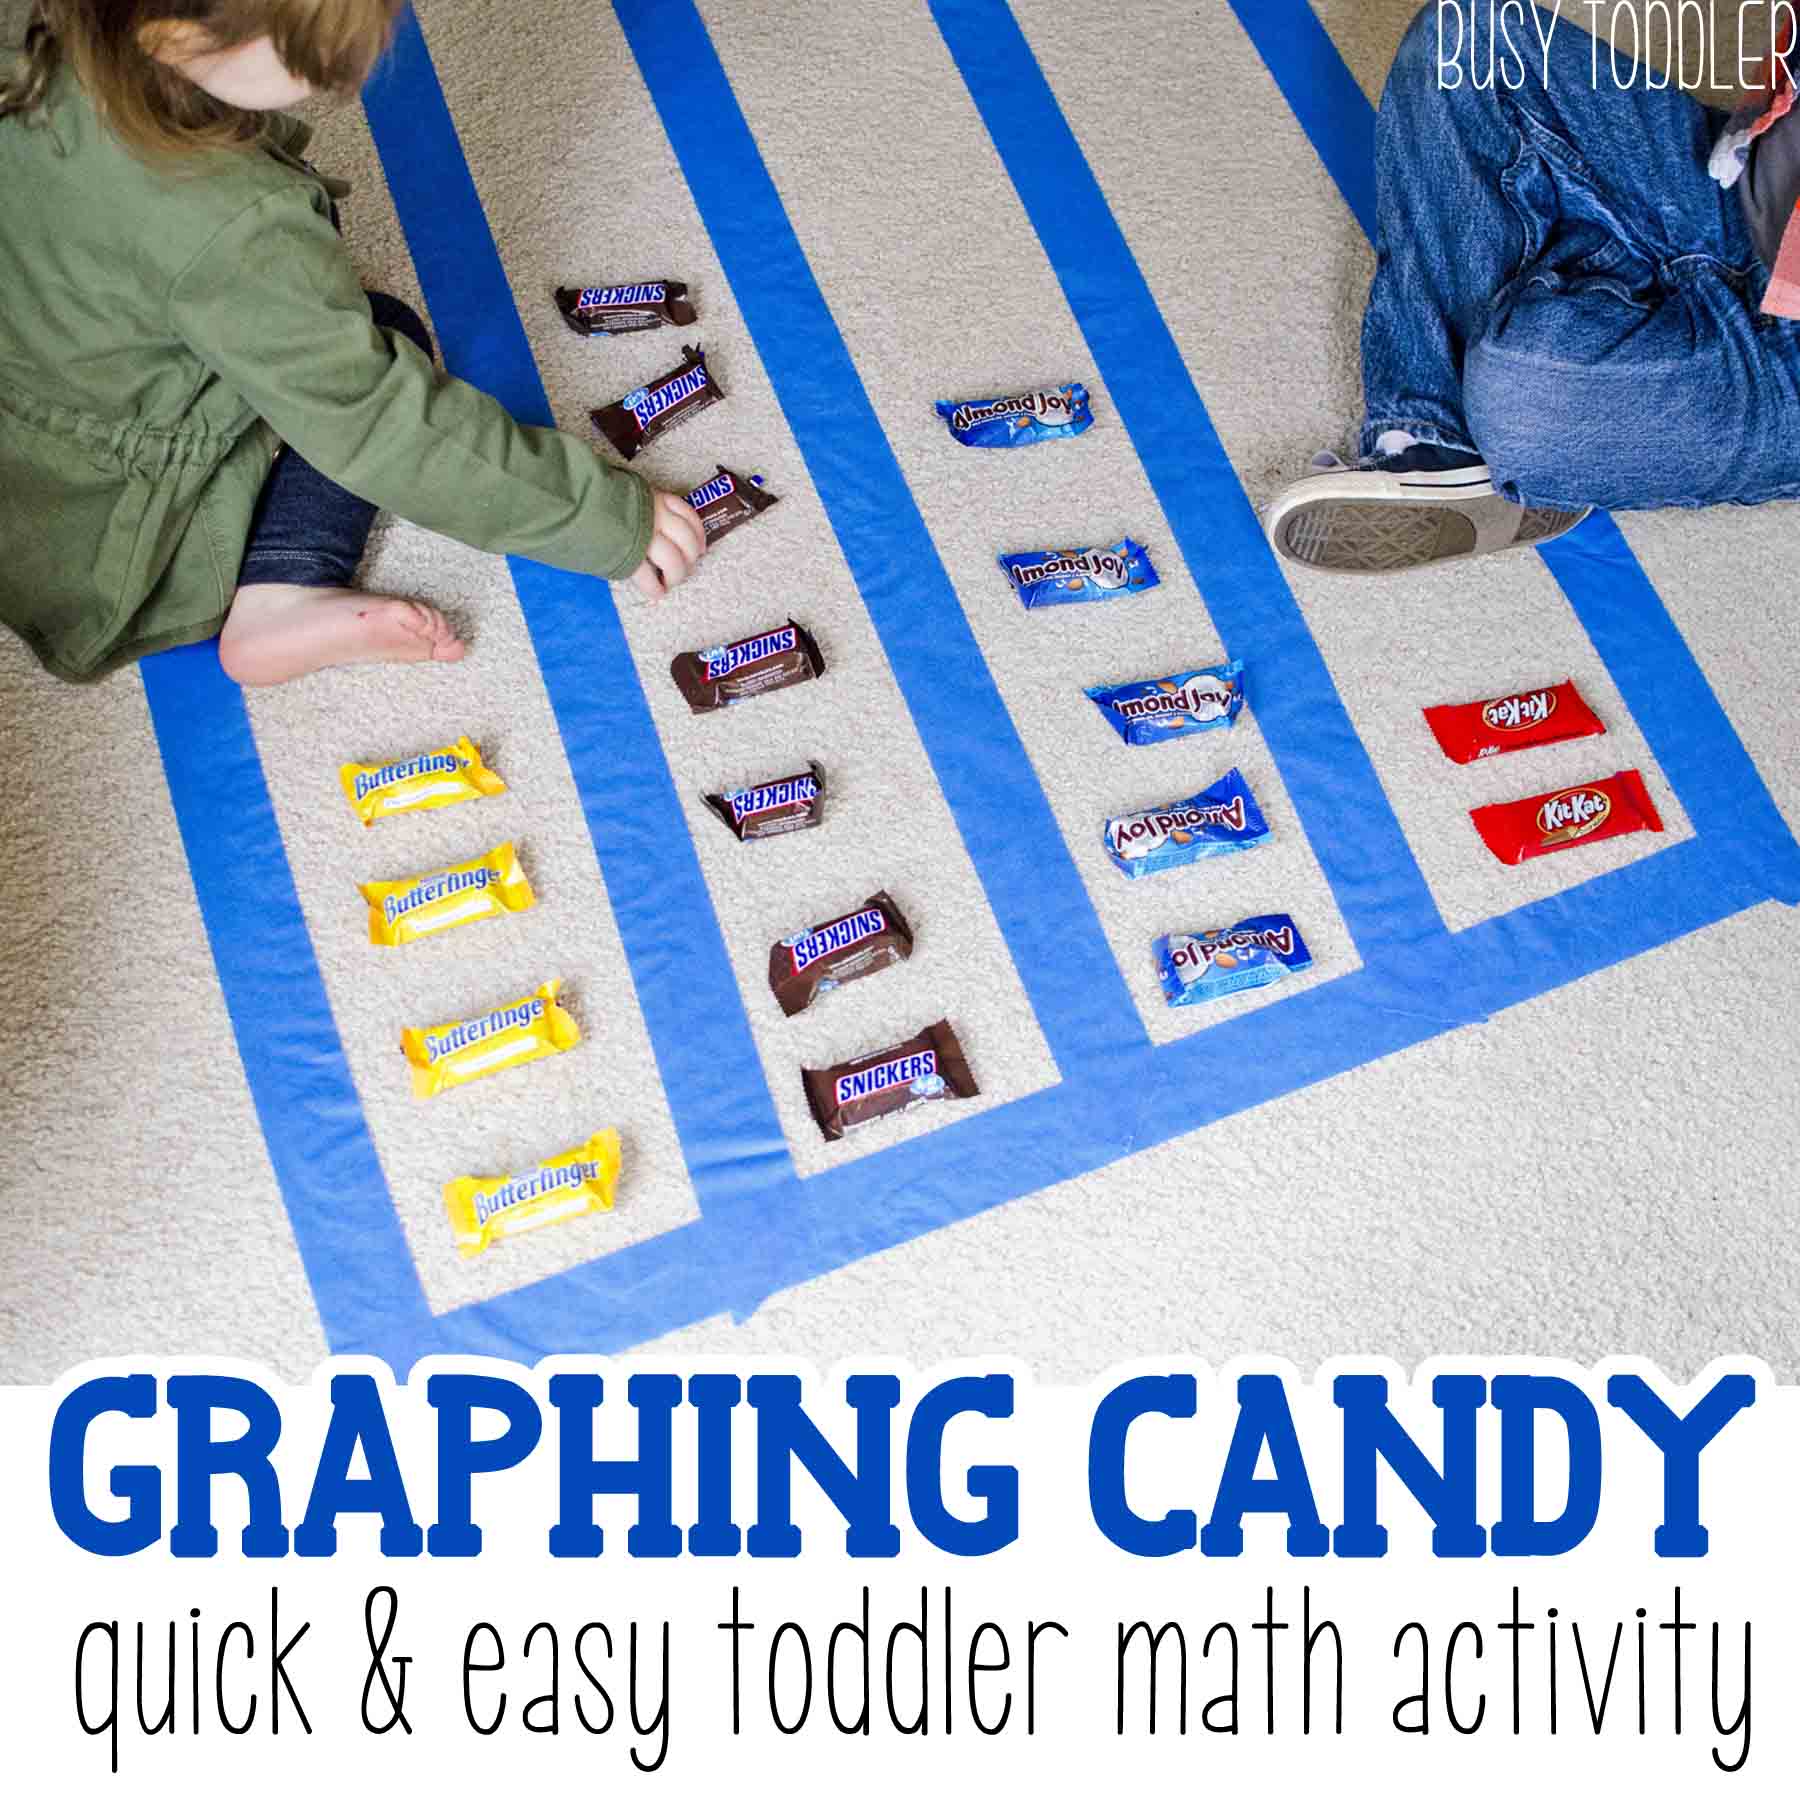
We’d talk about which group was larger, which group was smaller, and sometimes, I’d grab a handful and we’d create a make-shift graph (please see the adorable photo of candy graphing that I’ve included).
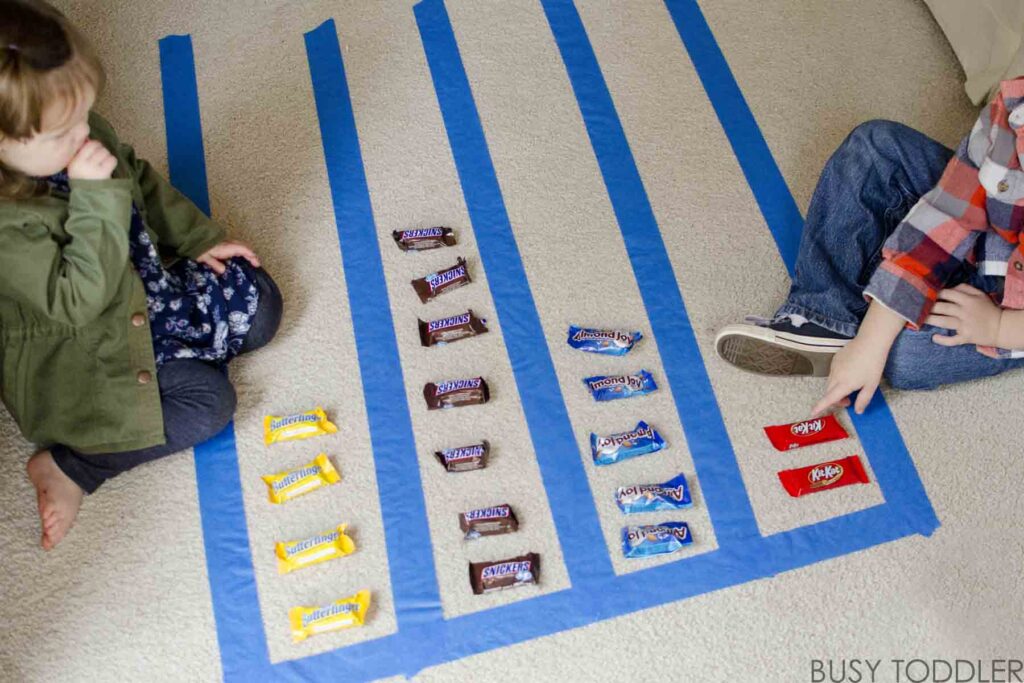
It was a simple way to compare candy “data” and add a little mathematical learning into Halloween. What a win.
But as my kids grew up (they tend to do that), I saw Halloween as an opening into more mathematical learning that we don’t get from day to day life. I wondered What if we actually did something with the piles of candy after we sorted them?
My husband – a first born who has never met a spreadsheet he didn’t want to add a formula to – saw an immediate idea: Let’s take the candy data and create graphs in Excel.
The basics of the Halloween spreadsheet
Here’s a brief overview before I get into the nitty gritty: Every year, after trick-or-treating is over, my kids sit on the floor and sort their winnings. They later tally each candy’s amount on paper then work with my husband over the next few days to transfer their data into Excel. Together, they use that data to build graphs.
As for me, I hate Excel. We have beef.
I want to be upfront with my feelings, which are passionately opposed to Excel, except for this one time each year. This is the only time I see the beauty in Excel as we figure out the difference between this year’s Reese’s Peanut Butter Cups haul to last years and review some hard data about Sugar Babies.
Candy spreadsheet making: Step-by-step process
Below, you’ll find the five steps my family takes to make these graphs each year. We don’t rush this project, except for sorting the candy and collecting the amounts. We do that part the day after Halloween to get the most accurate data, save for what we eat the first night. We simply bless and release that data.
The rest of the project takes place over the course of the week following Halloween, time permitting.
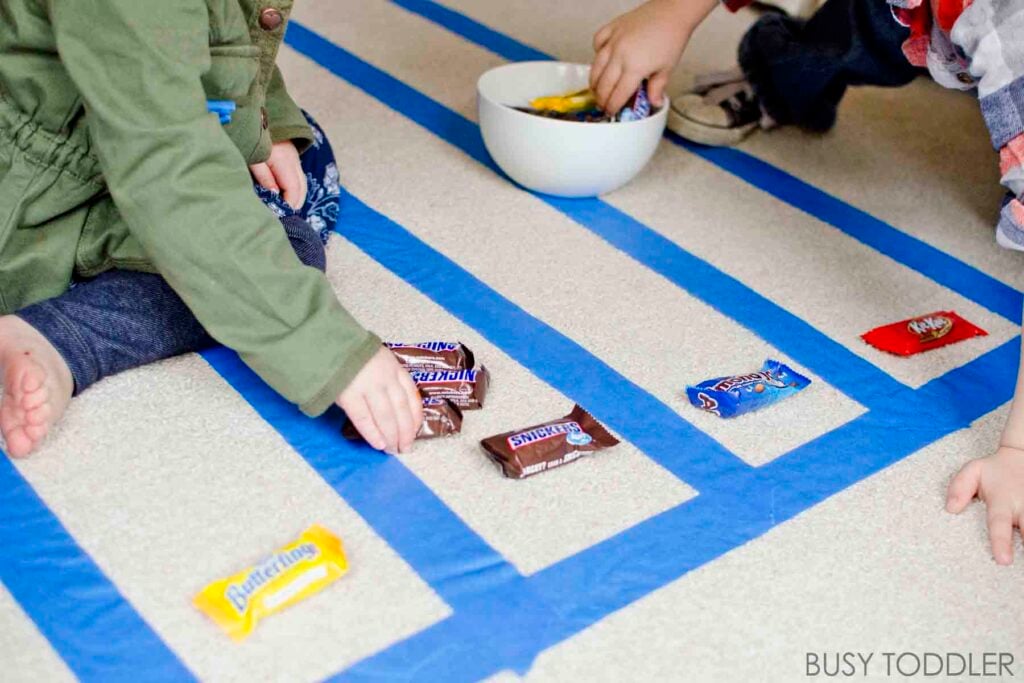
Step 1: Sort the Candy
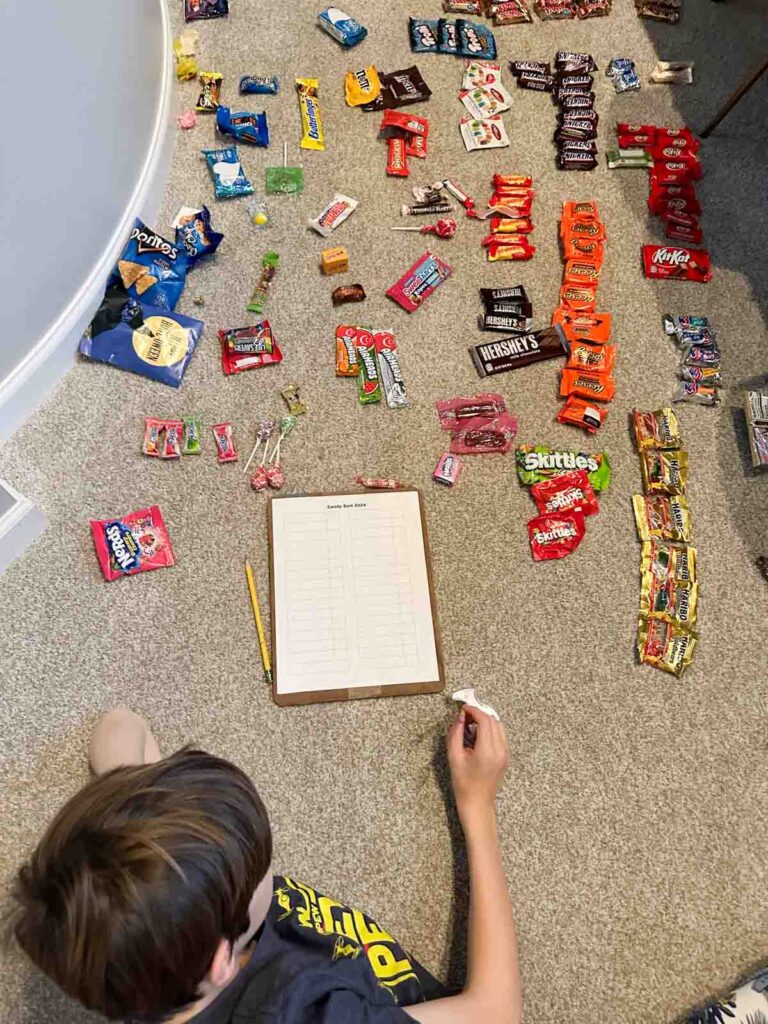
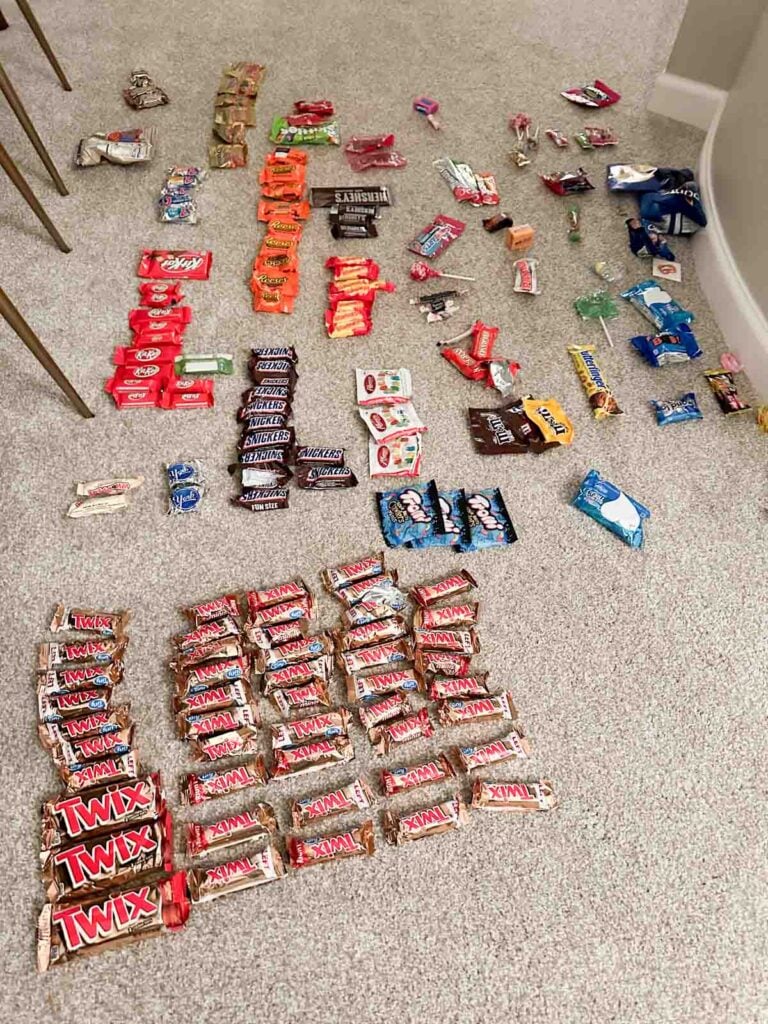
The day after Halloween, after the initial “eat some winnings” post trick-or-treating, my kids each find a spot in our living room to sort their candy. This part is simple and straight forward: make groups of like objects.
This does open up interesting conversations, like do you count all Skittles as one group or categorize tropical and sour differently from original (these are the tough family decisions you’ll have to make on your own – for the record, we count them separately).
Here’s some nuances we’ve developed, just so you’re prepared for the conversations that may await:
- Flavored Tootsie Rolls all count together but are separated from original chocolate
- Lollipops are sorted by type not flavor
- Subcategories are made into separate piles (Snickers Crunch, Kit Kat flavors, etc.)
Remember, we’ve been doing this four years. We’ve developed a family code, inside jokes, and specific rules that are – well – specific to us. Have fun with this, don’t take it too seriously. We laugh at these kind of detailed “rules” we’ve formed.
Step 2: Count and Record the Amounts
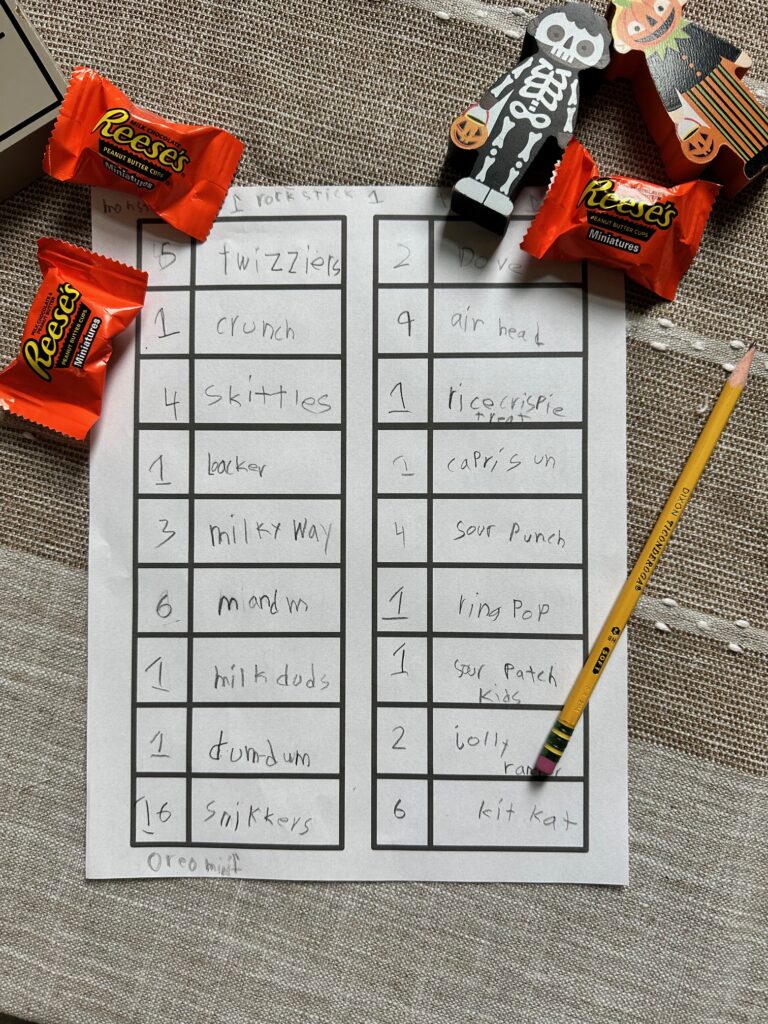
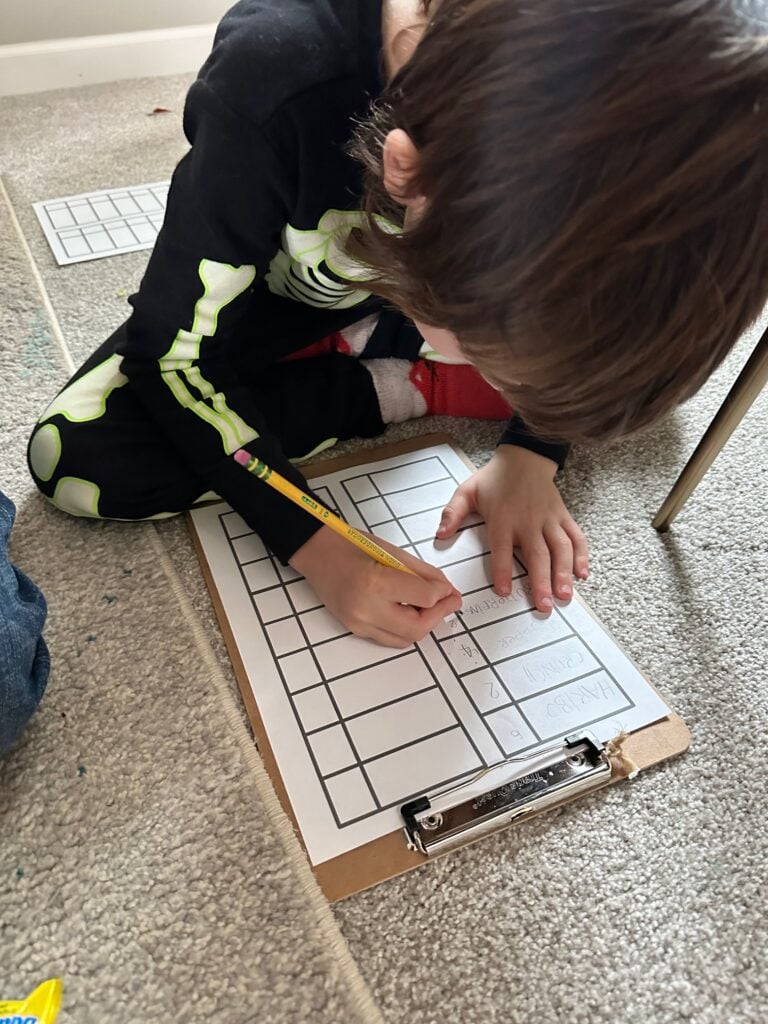
The next step in the great candy spreadsheet is to count each group and record the amounts. I created a VERY simple worksheet for this. You can make your own or download mine (it’s not fancy but it works!).
I give my kids clipboards and plenty of time to do this. We work on this on and off the day after Halloween which is the perfect day for this kind of “busywork.”
I vary my level of involvement based on age and ability. At first, I did all the writing and they did the counting. It was a team sport. Over time, we’ve worked our way up to my kids completing this step on their own (they’re 9, 10, and 12 now).
A couple of notes: Don’t get caught up in the writing part of this activity. It can be overwhelming depending on their age/ability level. Remember that this is a data collection and math activity. It would be a shame to miss out on this learning over a handwriting standoff. Offer your hand, be their secretary, and take over copying candy names if that’s helpful.
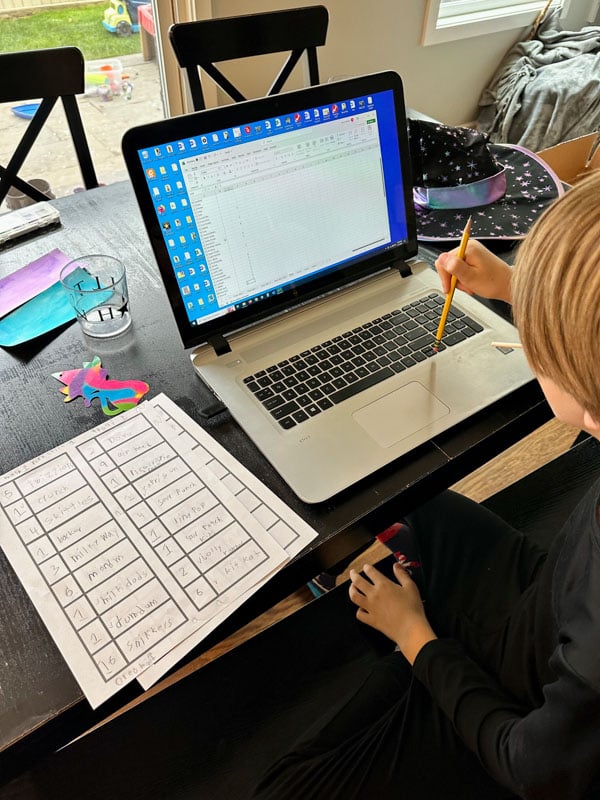
Step 3: Transfer the Data to the Computer
In the next few days, we begin to transfer the pen and paper data onto the computer. We open an Excel spreadsheet (Google sheets works too), and enter each type of candy and its amount into the computer.
My husband sits with each kid one at a time and helps make sure their data gets entered correctly.
Over time, this has become something my oldest can do on his own. My middle and youngest still very much need the support of an adult typing the candy names and amounts.
No matter their age or level, this is a great time to start introducing or working on different typing skills.
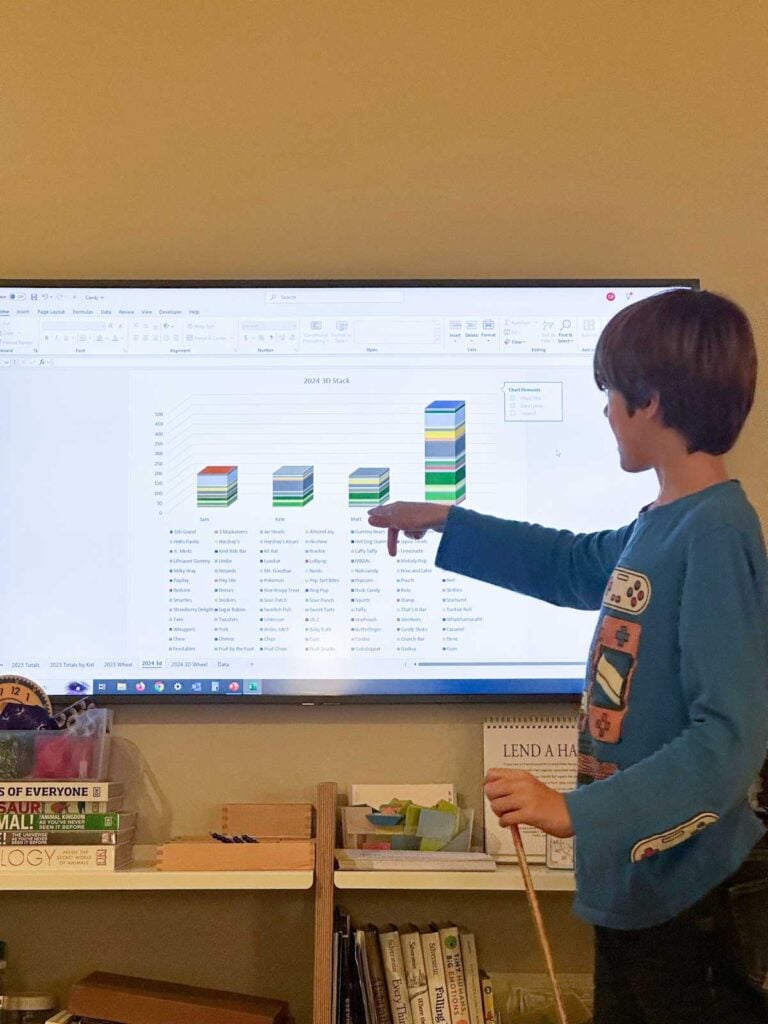
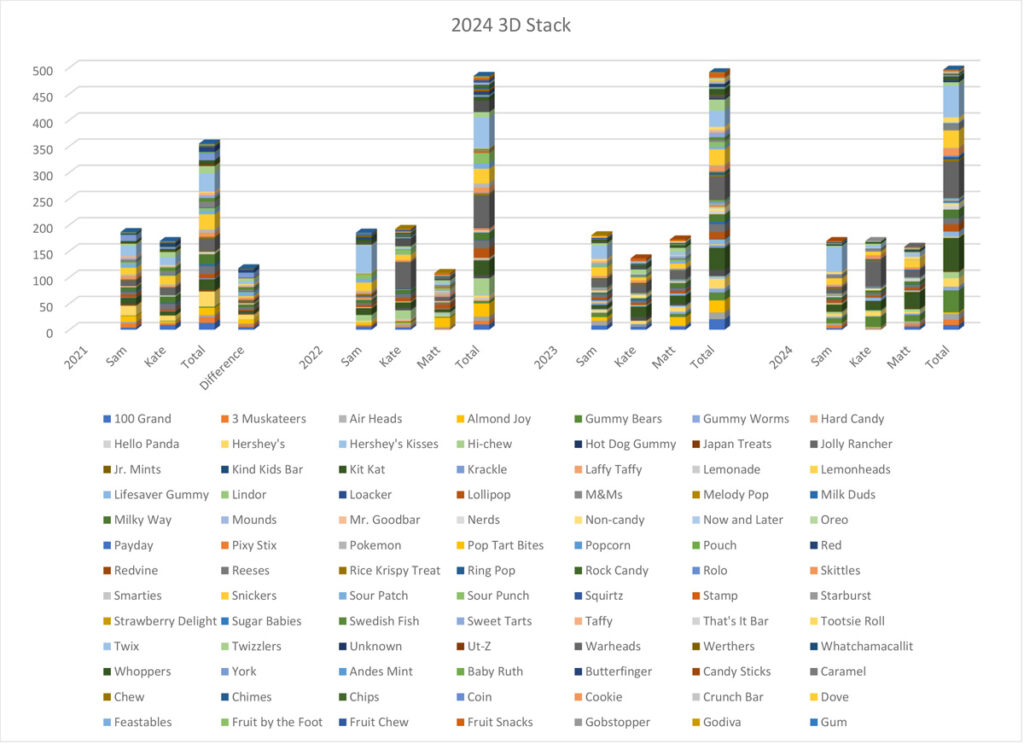
Step 4: Make the Graphs
A few days after all the data has been collected and entered, my husband and kids sit together for this next part of the activity. I hang back because at the end, they’ll present this data and they need an audience member.
Turning the columns of data (candy name + amount) into graphs is really easy in Excel and Google Sheets. In both, highlight your data > inserts > graphs.
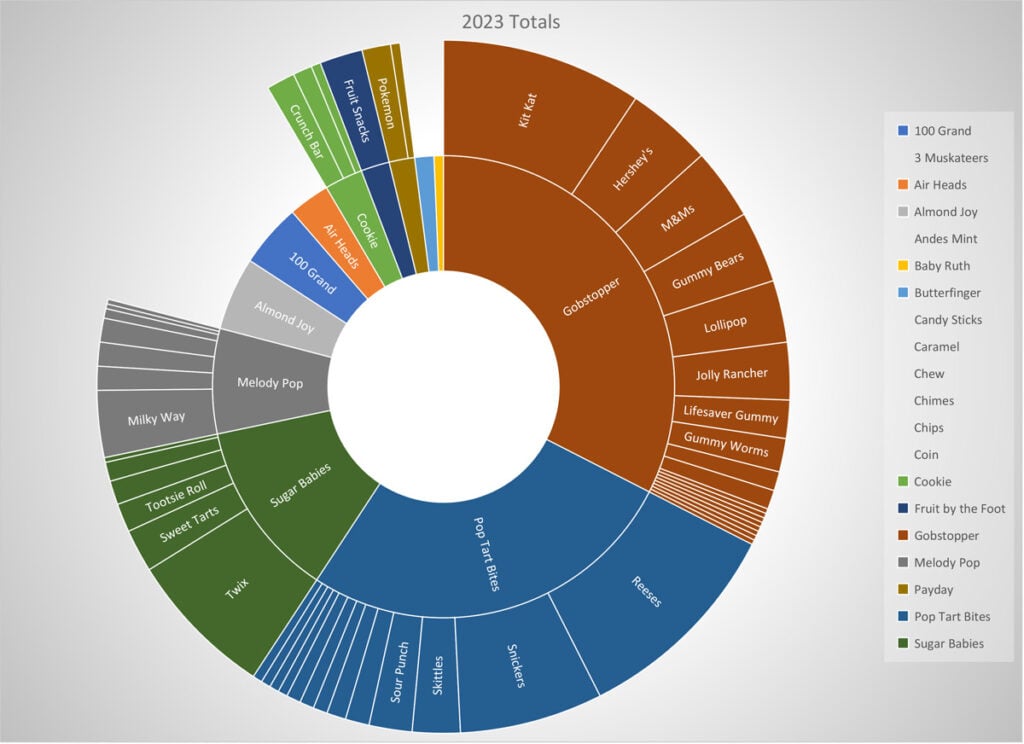
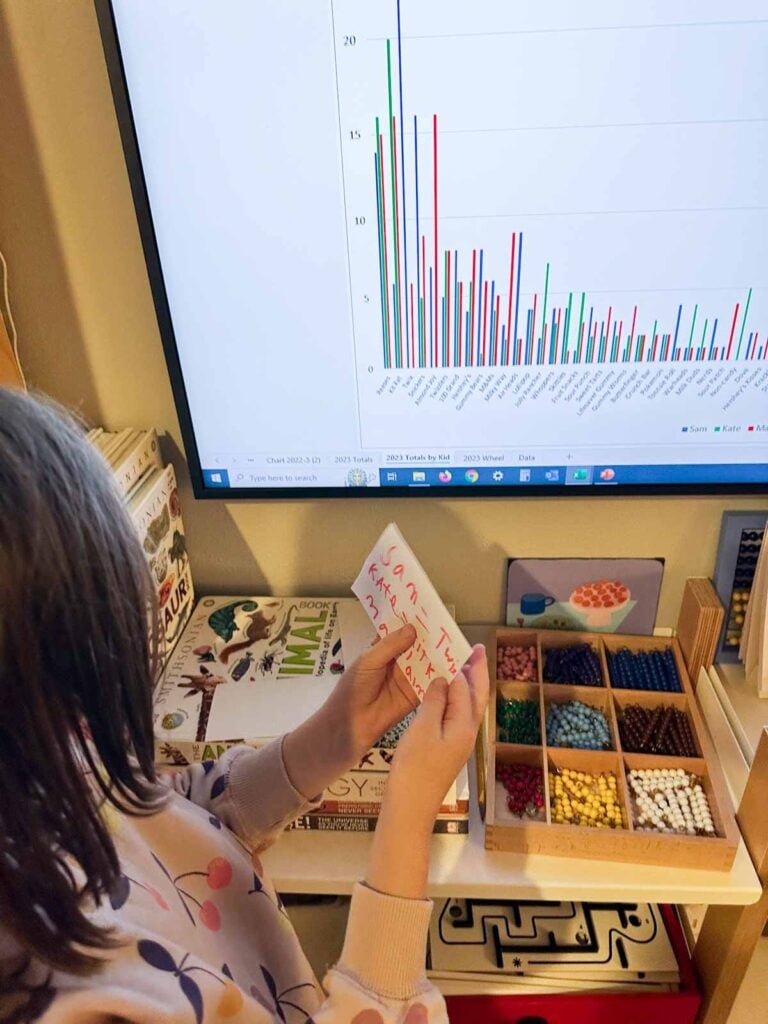
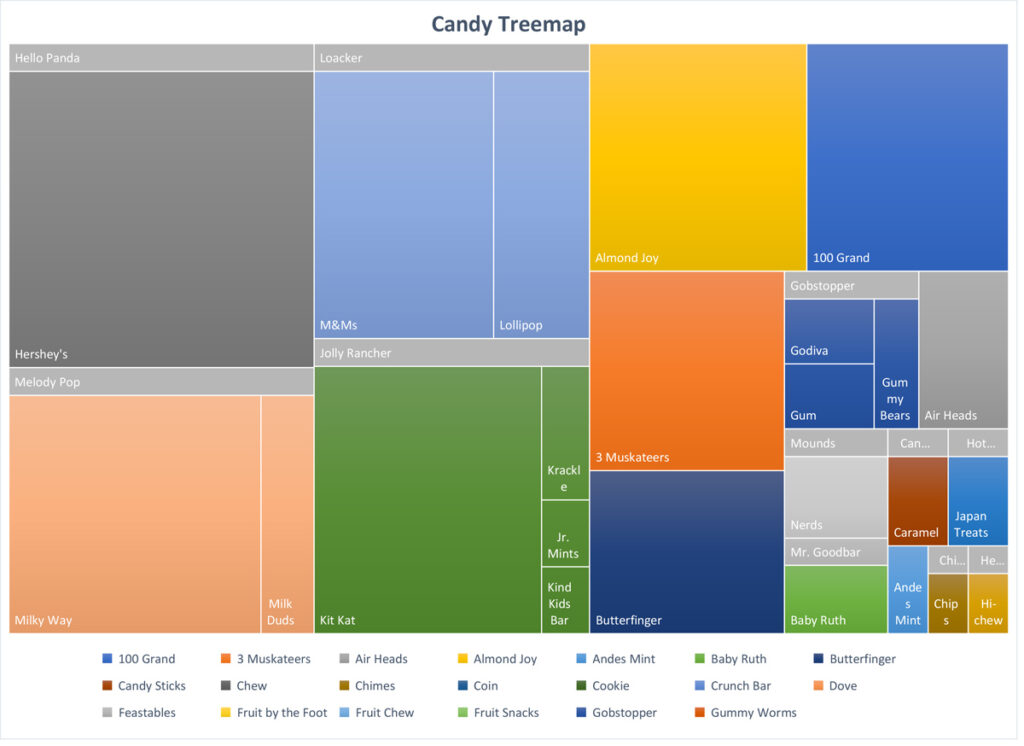
My kids do a mix of treemaps, pie, and various bar graphs, placing them on different sheets, and creating a “formal” presentation.
As my husband builds these graphs with the kids, he’s teaching them about computer operations. Phrases like “insert,” “copy,” and “save” that are second nature to us are important for kids to hear, see, and practice.
This will be our 5th year making these spreadsheets so my kids also track year over year data. It’s been some of the most fascinating! We’ve watched trends with candies shift, watched their own tastes change, and noted the amount of candy each year stays relatively the same.
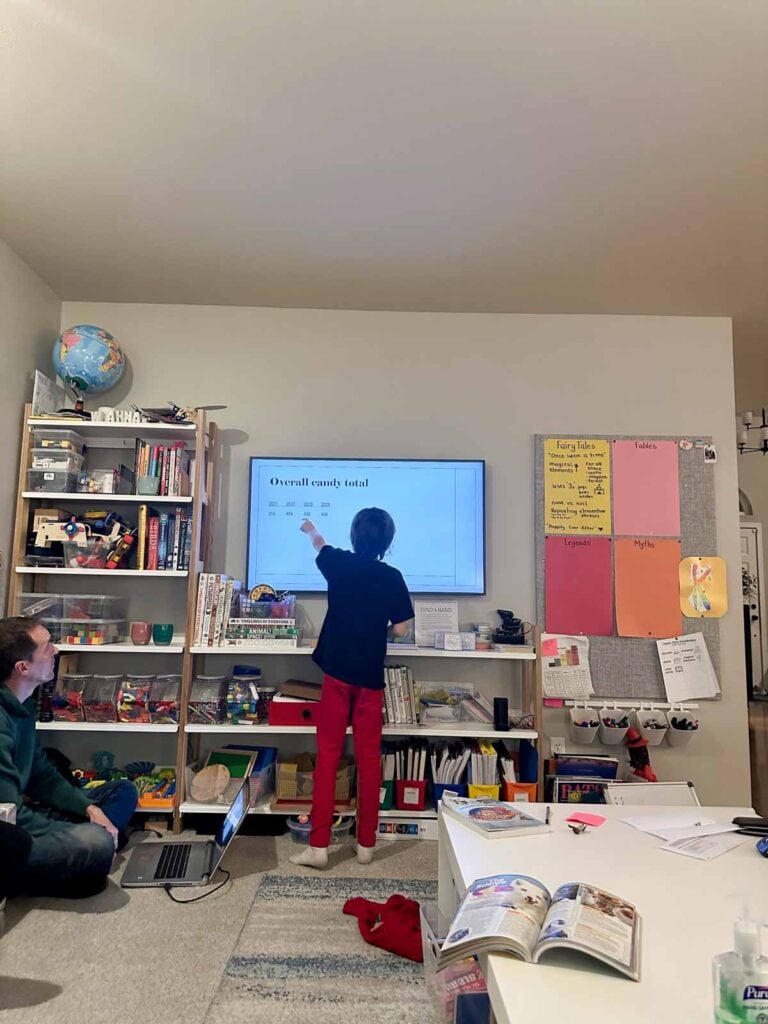
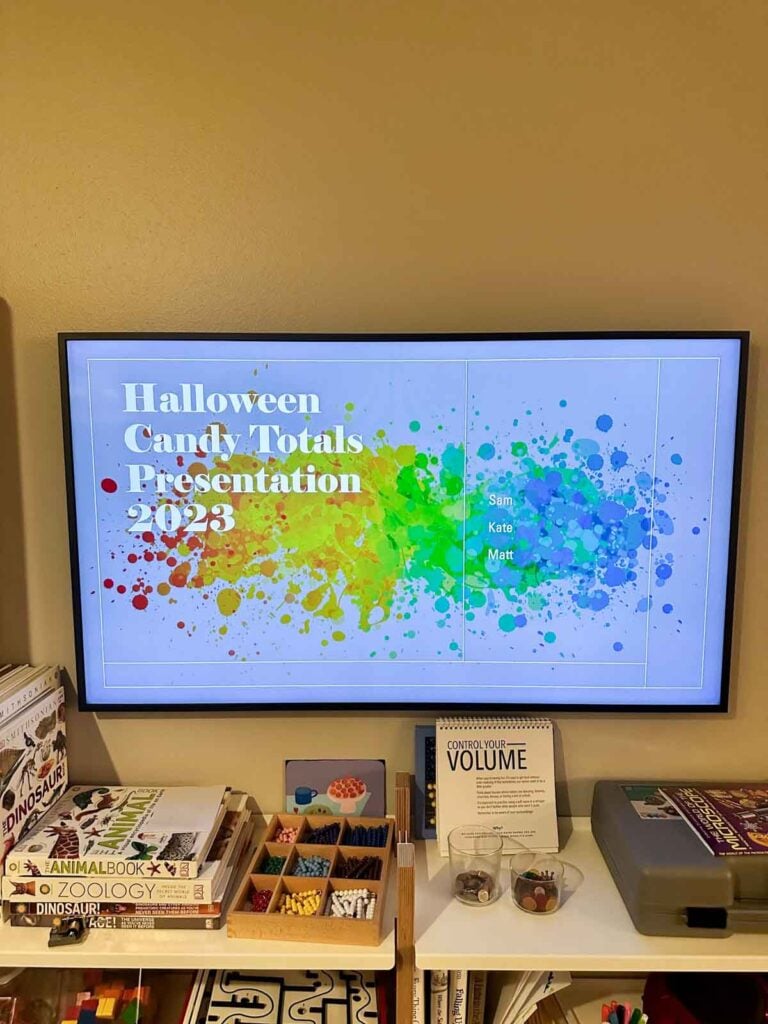
Step 5: Present the Data and Findings
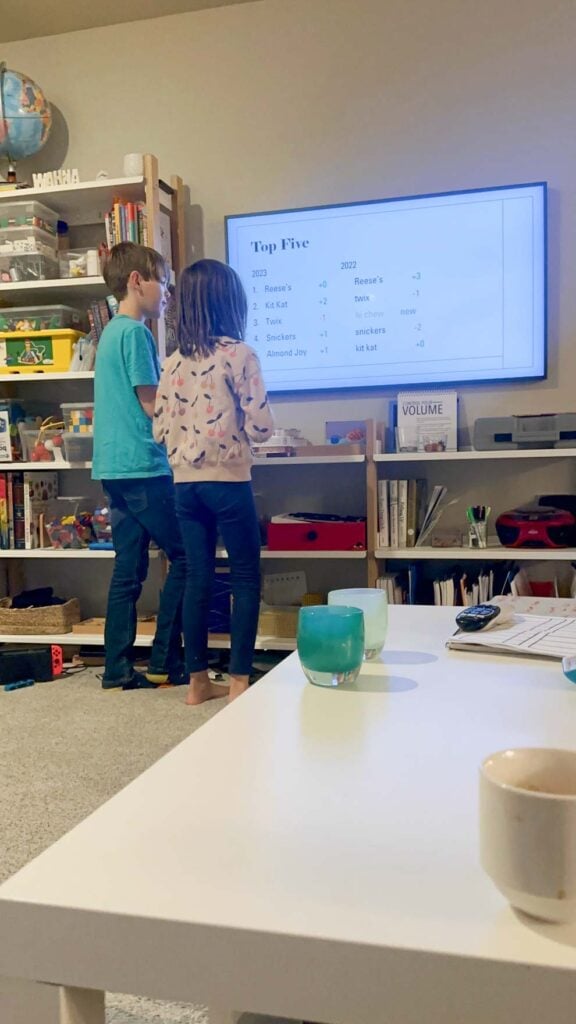
One of the best parts of this project is that my kids present their data to me as a “presentation.” Even though I’m just mom and this is just a fun post-Halloween project, presenting the data and their observations at the end is my kids’ favorite part.
They take turns highlighting different trends they’ve noticed or things they want me to see. Sometimes, they make note cards to remember their talking points and it’s just plain adorable.
Here’s some things they note each year:
- Their personal candy trends (most, least, any amounts the same)
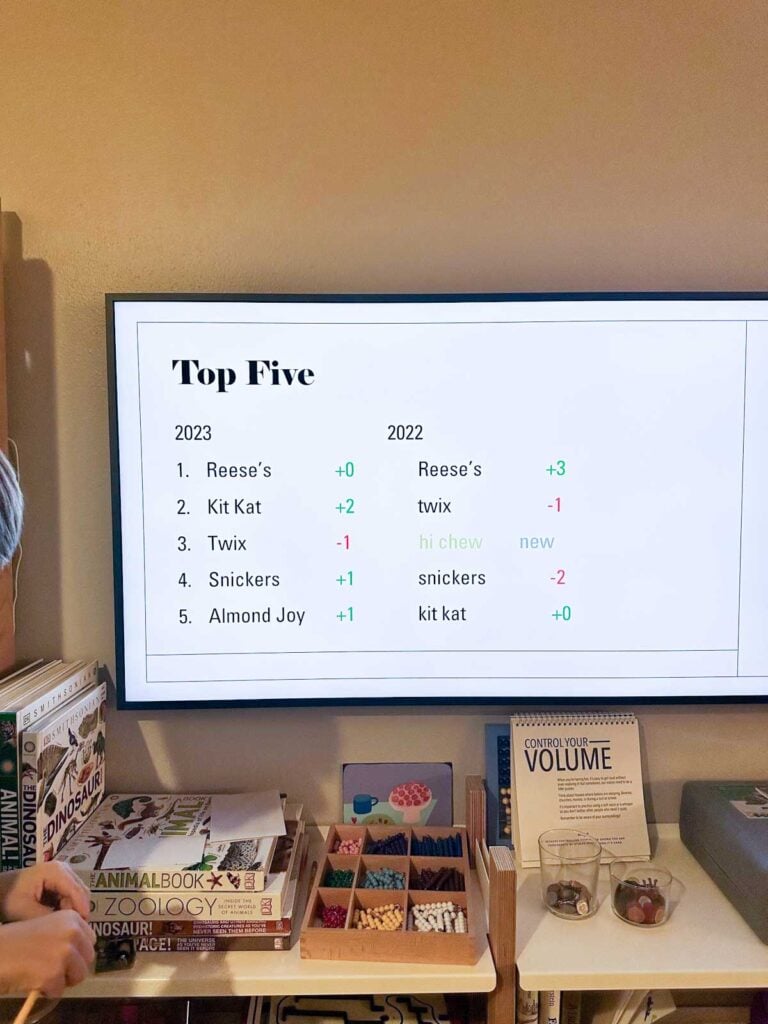
- Year over year differences for their data (same top candy?)
- How their candy stacks up to their siblings candy totals
- Any overall trends (like the mass drop off of Almond Joys and the surge of Hi Chew)
Why we do this activity each year
This is a “without fail” activity for my family each year. It was fun the first year – but each year, we have more and more fun pouring over the data. My kids look forward to seeing how this year’s data will compare to previous years.
Watching trends change, hearing the kids talk about the data, and observing their growing skills in computing, I can’t think of another project we embark on yearly with more learning bang for the buck. For all that we gain from it, it comes together pretty easily, has absolutely no cost, and we all get so much out of it.


 Subscribe to my free newsletter and I’ll send you “35 Easy Toddler Activities to Break Up the Day!”
Stephanie says
I love this, but I need help with the spreadsheets! I would love for formulas or steps on creating the graphs!
Heather says
Love this! We just did it. Passing on the spreadsheet love from one generation to another!