
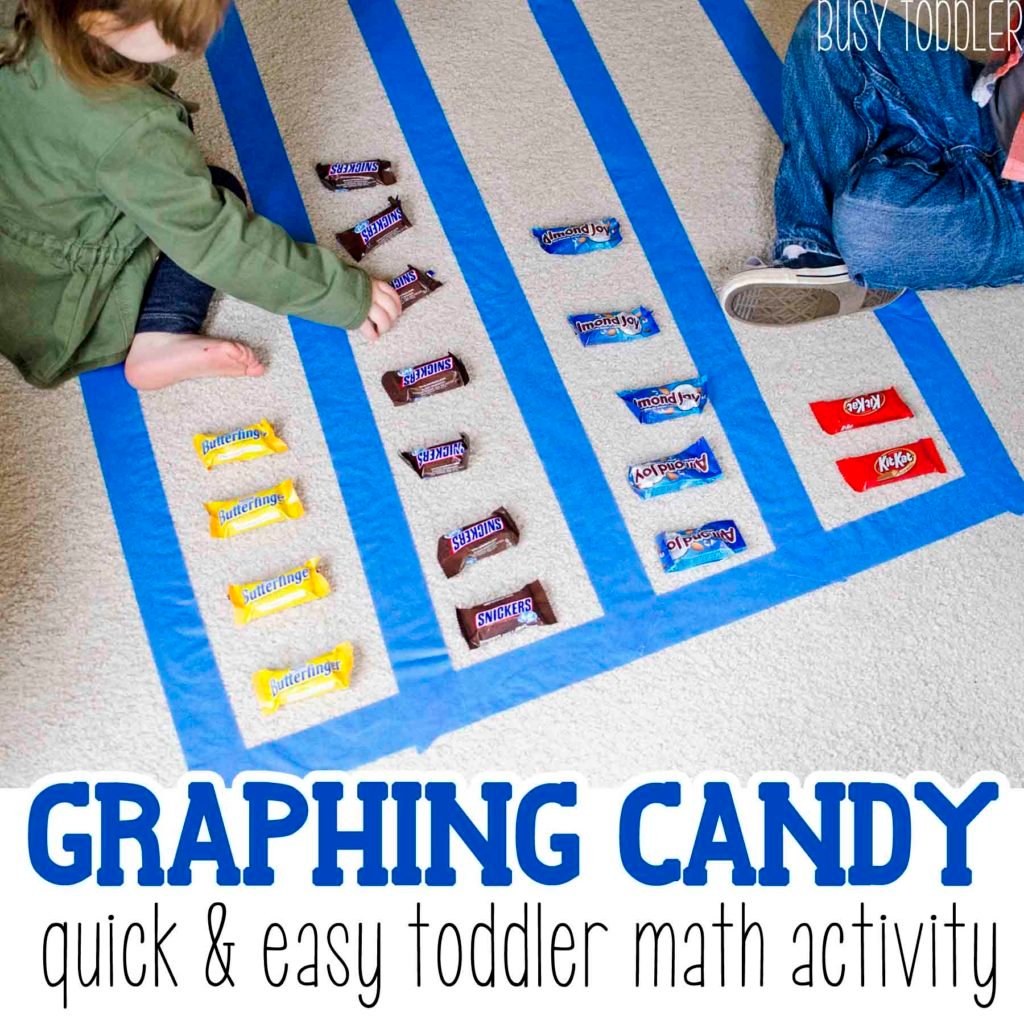
Need a fun and delicious post- Halloween math activity? You’ve got to try graphing candy. It’s a simple, silly way for young children to play with math and enjoy their candy at the same time. It’s a great way to finish off Halloween.
Can kids really graph candy?
Graphing is a fantastic activity for toddlers, preschoolers and big kids. While it may sound or look meaty and intimidating, it’s a surprisingly easy math concept to introduce.
A graph is just a fancy way to organize information. This gives kids a way to see data, quantify it, and understand it better. It helps to easily identify math concepts like more, less, and same/equal.
My kids and I play with graphs all the time, but making it a post Halloween candy graph really takes it over the top.

Supplies
Busy Toddler is a participant in the Amazon Services LLC Associates Program, an affiliate advertising program. As an Amazon Associate, I earn from qualifying purchases. Read more about these links in my disclosure policy.
- Candy (choose a few types and vary the number/amount of each)
- Tape
- Excited post-Halloween kids
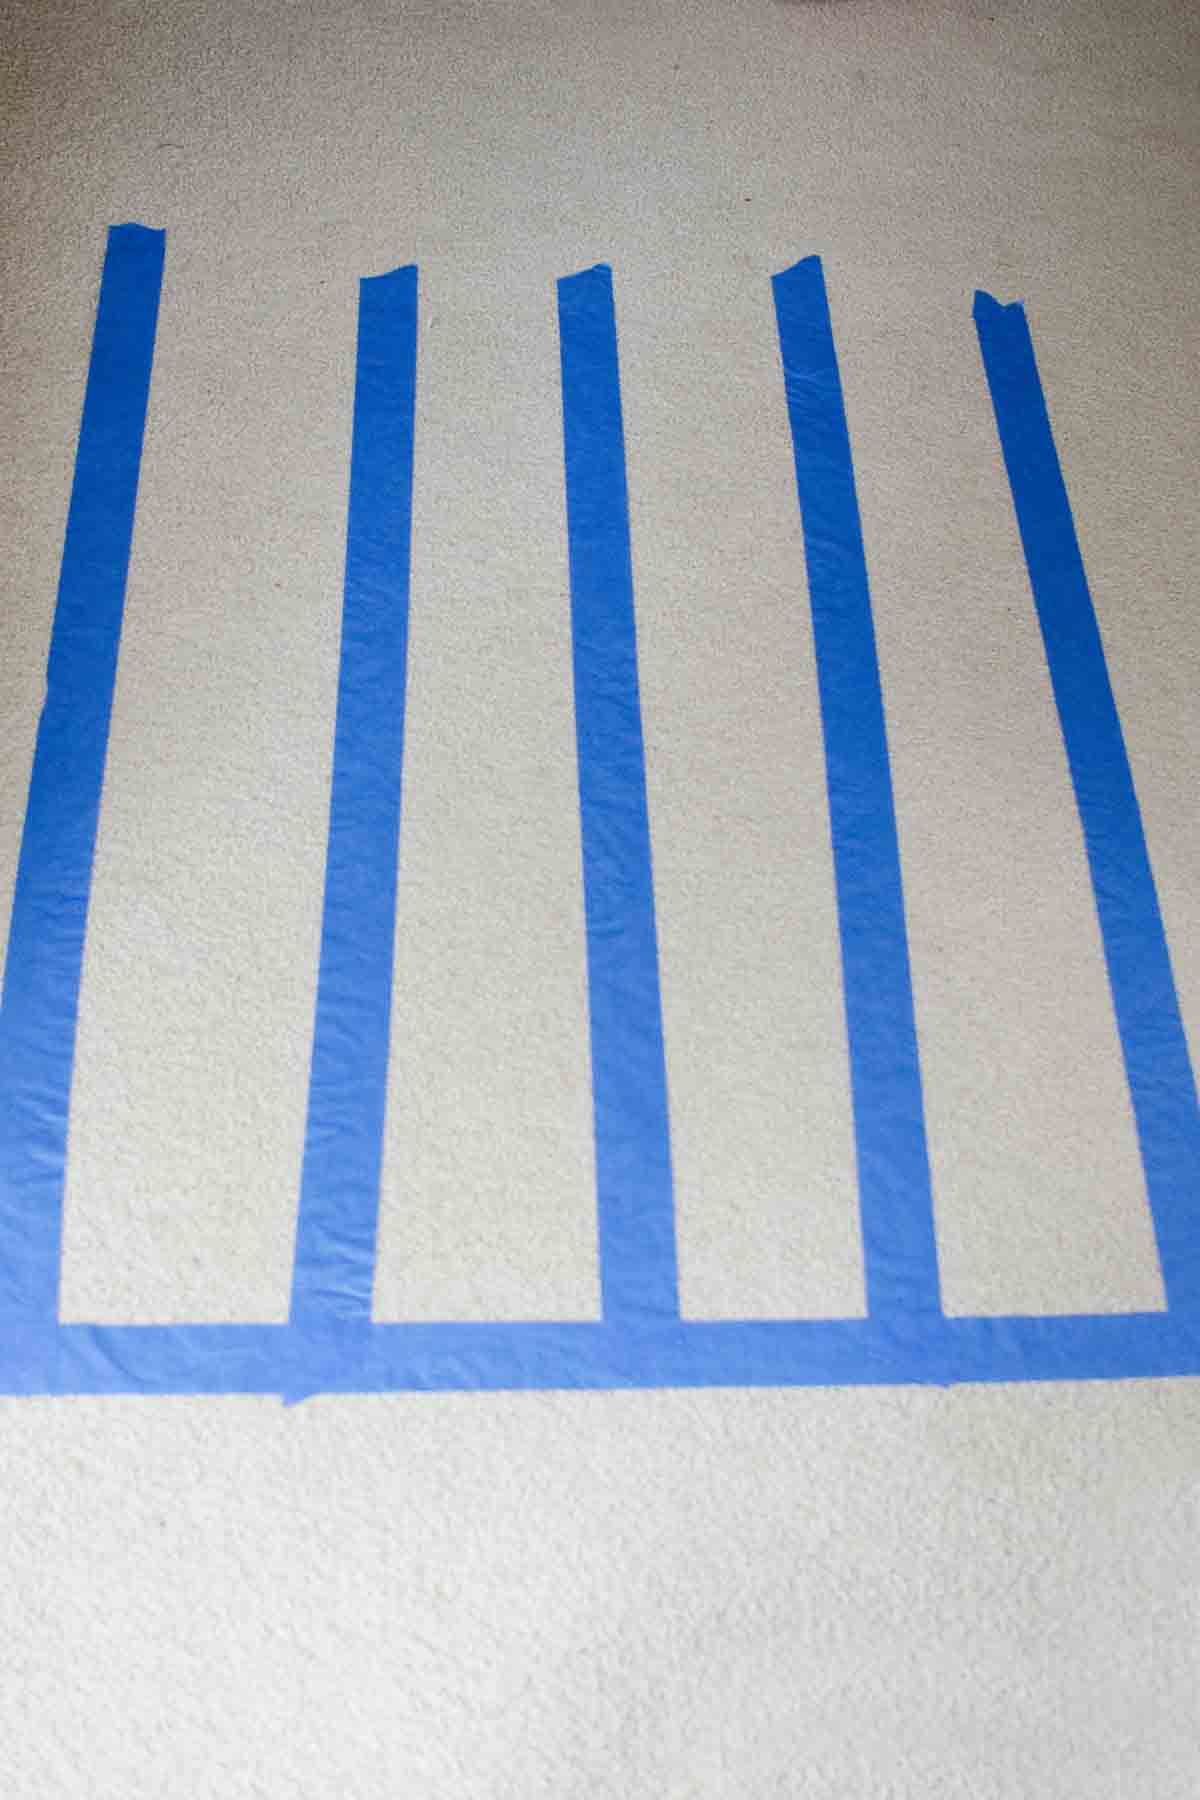
I decided to make this a large scale activities and taped out a graph on our family room floor. I used blue painter’s tape – which worked great.
I made a base line and vertical columns (enough columns for each type of candy we’d be graphing).
Starting your candy graph
With my kids (ages 3 and 21 months old), I picked out four candy types to graph and made sure to have a varying number of each type.
I also made sure not to have a higher amount than they could touch and count. Having too many candy bars would have overwhelmed them. I kept the numbers on the small side.

Task 1: Sort the candy
My tots sorted the candy into the four columns. They started by just making piles for each type of candy.
Sorting is a big concept in the early years – they’re recognizing similarities, differences, and categorizing based on attributes. It’s bigger than it appears!
Once they finished, I lined the candy bars evenly just as they would be in a traditional graph. Older children may be able to line up the candy on their own, but at my kids’ ages, I needed to do this and model the process for them.

Task 2: Answering questions about the graph
Asking and answering questions about the graph is the meat and potatoes of this activity. Sure, you can make or look at a graph – but can you actually use that graph to understand the data?
Here’s a sample of some of the questions I asked my kids:
- How many candy bars are in each column?
- How many candy bars are there altogether?
- Which candy bar do we have the most of?
- Which candy bar do we have the least of?
- How many more Snickers bars are there than Butterfingers?

Activities like this have so much longevity – I used to do this very activity with first graders. Graphing is a great skill for kids to learn, and isn’t nearly as daunting as it may sound at first.
If you don’t have a variety of candy bars lying around, consider graphing the contents of an M&M or Skittles packet.

This may be a simple activity but it’s an activity that packs a punch: sorting, organizing a set of data, answering questions about a graph, using 1:1 correspondence, etc.
Graphing is a great easy math activity and one of my favorites!
Frequently Asked Questions
No – but we had made a plan before starting that they could each pick one to eat at the end. They pre-selected their candy before ever building the graph so they knew exactly what was coming. They weren’t nervous or concerned about the candy while it was being used as a math manipulative. They knew what was coming.
It depends on the child. My daughter was 21 months old here, but she was getting a second-kid bonus with help from her 3.5 year old big brother. Think stages not ages: consider your child and where they are at mathematically. Would they enjoy this? Would they be able to do parts of the activity with you?
Use a pack of skillets or M&Ms and build a construction paper sized graph. When I was a teacher, I would often do this with my students at their desks as part of “munchie math.”


 Subscribe to my free newsletter and I’ll send you “35 Easy Toddler Activities to Break Up the Day!”
Oliver’s mom says
Love this idea. I’ll be trying this out this week. Thank you!